The M&A environment has been very active over the past 18 months, which can be attributed to the significant surge in the housing market and the increasing number of business owners looking to retire. With the increase in M&A activity, there are plenty of success stories in which sellers are getting very high multiples for their business. However, this is not always the case. The M&A environment has resulted in increased valuations, but they may not always be as “hot” as you might hear.
Having a clear understanding of recent multiples trending in your industry can help you better determine your business’s value and plan for an eventual transaction. This article will summarize information from the DealStats Value Index for Q1 2022.
Multiples continued to rise throughout 2021 and into Q1 2022 for various financial metrics. EBIDTA multiples in 2022 have continued to trend in a positive direction as the median selling price per EBITDA across all industries increased from 3.5x at Q3 2021 to 3.9x at Q4 2021 and to 4.5x at Q1 2022. This pattern appeared consistent with the normal levels seen from 2016 to 2019 of 4.0x to 4.5x EBITDA.
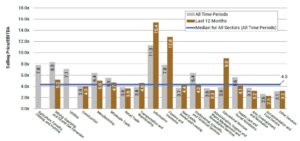
EBITDA multiples varied significantly depending on the company’s industry. Over the past twelve months, the information sector yielded the highest selling price for EBITDA at 15.4x, while the food service industry yielded the lowest at 2.6x.
The table below illustrates the median selling price per EBITDA by industry for private companies:

Companies in the mining, quarrying, and oil and gas extraction sector; the finance and insurance sector; utilities sector; agriculture, forestry, fishing, and hunting sector; and the information sector transacted at higher net sales and earnings-based pricing multiples than most companies in other industries.
It was also noted that public buyers tend to spend more on private companies than private company buyers, as public buyers may be better able to utilize synergies between the target and the buyer. Public buyers also tend to purchase larger companies that sell for higher multiples.
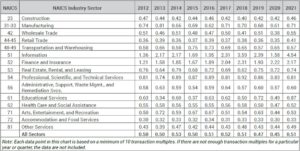
Median EBITDA as a percentage of revenue (EBITDA margin) reached 17 percent at Q1 2022, which is greater than the traditional range of 11-12 percent experienced during Q1 2019 through Q3 2020. In addition, the median selling price per net sales increased from 0.46x at Q1 2021 to 0.50x at Q2 2021/Q3 2021 to 0.58x at Q4 2021, hitting its peak in Q1 2022 at 0.64x. This differs from the declining median selling price per net sales, which went from 0.53x at Q3 2017 to 0.43x at Q2 2020.
Median net sales multiples for private companies increased in 12 of the 15 industry sectors in 2021. The sectors that saw a notable increase were retail trade; information; education services; and arts, entertainment, and recreation. One sector that saw declines was transportation and warehousing, which faced a notable 12 percent decrease from 0.65x in 2020 to 0.57x in 2021.
The following table illustrates the median selling price per net sales by sector for private companies:

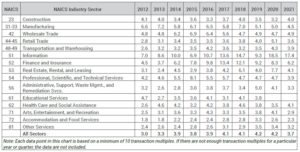
Median EBITDA multiples saw an increase in three sectors. Notable increases were in the construction and home care and social assistance sectors (increases of 24 percent and 17 percent, respectively). On the other hand, 12 sectors saw a decrease, including the real estate and rental and leasing sector, which experienced a 47 percent decrease from 7.7x in 2020 to 4.1x in 2021.
The following table illustrates the median selling price per EBITDA by sector for private companies:

No one can predict exactly how much a company will sell for. However, having an understanding of recent multiples in your industry can better prepare you for a successful transaction. It is also important to understand who your potential buyers are and how to properly prepare your business for a transaction. If you have any questions or would like to learn more about this process, please contact us.

